The 20% Solution
Selective Colleges Can Afford to Admit More Pell Grant Recipients
A majority of Pell Grant recipients attend open-access colleges with low graduation rates (49%) even though thousands are qualified to attend selective colleges with high graduation rates (82%). The 20% Solution: Selective Colleges Can Afford to Admit More Pell Grant Recipients finds that about 86,000 Pell Grant recipients score at or above the median on standardized tests for students at selective colleges (1120 or higher on the SAT/ACT) but do not attend them.
Key Findings
Infographics
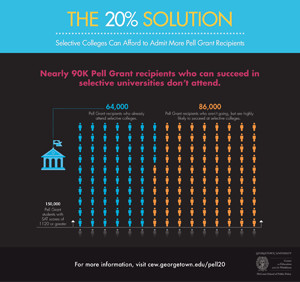
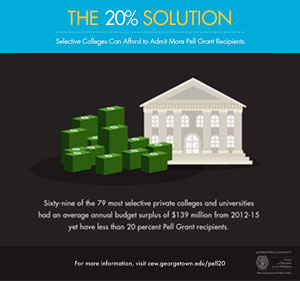
Table of Schools
Percentage of Pell Grant Recipients at More Than 5,500 U.S. Colleges and Universities
Explore the full list of more than 5,500 colleges and universities in America using this sortable table. Find your school by searching by institution name. Sort institutions by the percentage of undergraduates who receive a Pell Grant, how many additional undergraduate students would be needed to bring a particular institution to the 20 percent threshold (if applicable), and level of selectivity.
The level of selectivity is derived from Barron’s Profiles of American Colleges. The levels of selectivity have been consolidated from six categories into three: Colleges and universities listed as Selective are from Barron’s categories Most Competitive, Highly Competitive, and Very Competitive. Colleges listed as Middle Tier are from Barron’s categories Competitive and Less Competitive. Colleges listed as Open Access are from Barron’s category Noncompetitive or they are not categorized by Barron’s.
This list excludes institutions categorized as Special by Barron’s, colleges that don’t get Title IV funding, military service academies, and institutions with a full-time-equivalent enrollment of 100 or fewer students.
Filters
Source: Georgetown University Center on Education and the Workforce analysis of the National Center for Education Statistics (NCES)-Barron’s Admissions Competitiveness Index Data Files: 1972, 1982, 1992, 2004, 2008, 2014, and the Integrated Postsecondary Education Data System (IPEDS).
Budget Surpluses Of Selective Private Colleges
This interactive table includes 139 private colleges and universities that are selective and have enrollments that include less than 20 percent Pell Grant recipients. In order to be considered selective, they must be categorized by Barron’s Profiles of American Colleges as either Most Competitive, Highly Competitive, or Very Competitive. You can search by average budget surplus (deficit) and size of the endowment.
The average budget surpluses (or deficits) are calculated by averaging the 2012, 2013, 2014, and 2015 tax years, as reported by the colleges to the Internal Revenue Service, on Form 990s. These forms are required of all non-profit organizations. The endowments are as of June 30, 2016, as reported by colleges in an annual survey conducted by the National Association of College and University Business Officers and the Commonfund Institute. (Seven colleges in this list did not respond to the endowment survey)
Filters
Note: *Did not respond to 2016 endowment survey conducted by the National Association of College and University Business Officers and Commonfund Institute.
Source: Georgetown University Center on Education and the Workforce analysis of the Internal Revenue Service Form 990s filed by the colleges, National Association of College and University Business Officers-Commonfund endowment survey, 2016, the National Center for Education Statistics (NCES)-Barron’s Admissions Competitiveness Index Data Files: 1972, 1982, 1992, 2004, 2008, 2014, and the Integrated Postsecondary Education Data System (IPEDS).
Resources
Our report finds that if every college was required to have at least 20 percent Pell Grant recipients, an additional 72,000 Pell students would have to be admitted to 346 colleges and universities, half of which are selective colleges. Some selective colleges have suggested that Pell Grant recipients do not gain admittance because they would not be able to keep up with the workload. However, the Georgetown Center report finds that 78 percent of Pell recipients who attend selective colleges and universities graduate, while their chances to complete diminish to 48 percent at open-access colleges.